Resilience, as defined by the U.S. Department of Homeland Security is, “the ability to prepare for and adapt to changing conditions and withstand and recover rapidly from disruptions.” Ultimately, it is the ability of a system to return to normal. Resilience capacity is related to multiple stakeholders on campus and in the surrounding communities. Second Nature encourages a systems-thinking approach to resilience and encourages campuses to consider the relationships between the following five lenses: infrastructure, economics, ecosystem services, health and wellness, and social equity and governance. Visit Second Nature’s reporting platform to view UMBC’s Campus-Community Resilience Assessment Report.
UMBC currently utilizes a robust annual Hazards and Vulnerability Assessment (HVA) process. The resiliency assessment process permitted UMBC the opportunity to augment our HVA process by considering the additional challenges of a changing climate. By analyzing resilience indicators through natural, socio-economic, and built environment lenses UMBC not only identified additional strengths but also found several opportunities to bridge current resilience gaps. Explore the Resilience @ UMBC and the National Risk Index dashboard!
UMBC utilized the U.S. Climate Resilience Toolkit (USCRT) and the latest report for the Maryland Commission on Climate Change (MCCC) to identify and understand the anticipated impacts of climate change for Baltimore County/Baltimore City Maryland. USCRT offers observed annual averages from 1950-2013, climate model simulations (i.e., hindcasts) from 1950-2005, and climate model projections for two possible future scenarios (i.e., higher Emissions and lower Emissions) out to 2100. The MCCC relies upon the best available scientific data and projections available specifically for the state of Maryland. For this initial assessment, we considered the trajectory of the average higher and lower emissions scenarios.
The general summary of UMBC’s climate future is wetter and warmer.
Temperature
Average Daily Maximum Temperature Projections
Based on the currently available modeling, the average maximum daily temperature is expected to increase by approximately three degrees Fahrenheit by 2040. During the decade between 2040 and 2050 the average maximum daily temperature is expected to experience a significant divergence. In the higher emissions scenario, a temperature increase of approximately six degrees Fahrenheit is expected by 2100. Whereas, in the lower emissions scenario (a temperature increase of approximately one degree Fahrenheit is expected by 2100. The MCCC notes “Maryland is expected to have a notable increase in days with extreme heat (over [90°F] by 2050.”
Precipitation
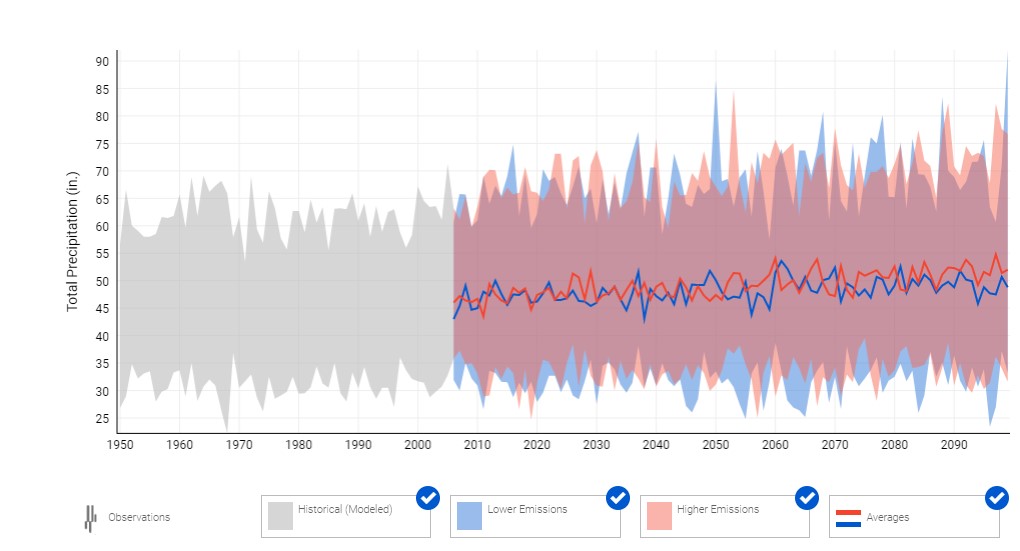
Total Precipitation (in) Projections
Annual total precipitation forecast projections remain at relatively constant levels, in both higher and lower emission scenarios, over the next 80 years. However, the projections suggest that Maryland will experience increased precipitation during the winter and spring with fewer changes observed in the summer and fall. This emerging pattern, coupled with greater evaporation and earlier snowmelt, will elevate the risk of experiencing drought conditions during the growing season.
Degree Days
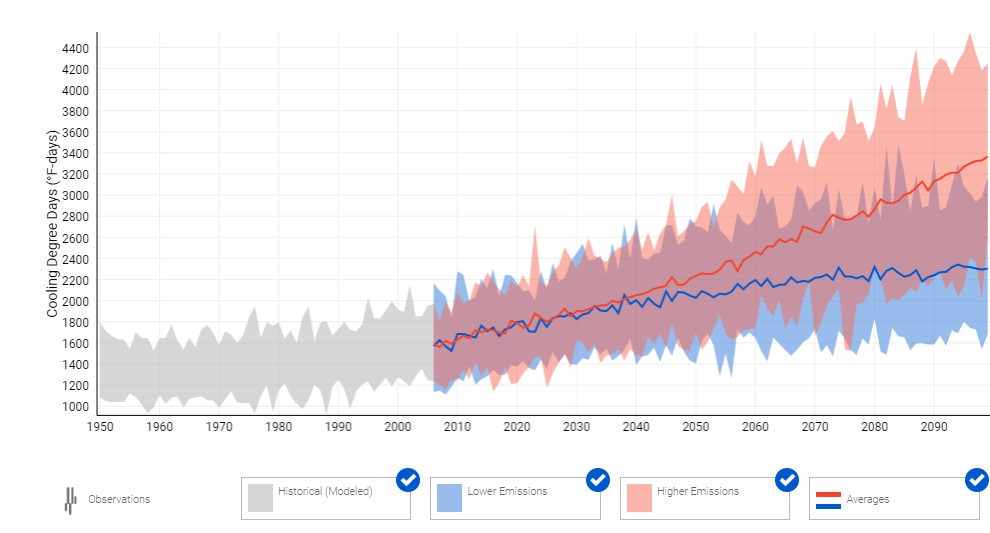
Projected Cooling Degree Days
Degree days reflect changes in climate and are used as an indicator for the energy demand for heating or cooling buildings and are the difference between the daily temperature mean and 65°F. In both high and low emission scenarios heating degree days (HDD) decrease; whereas, cooling degree days (CDD) increase. This anticipated change suggests that UMBC’s demand for cooling will increase as the cooling season is expected to last longer and have more intensity.
Assets & Strengths
UMBC has a number of strengths and assets associated with the university, which increase our campus resilience. As the campus continues to improve our resilience, we recognize the importance of sharing our best practices with not only the campus community but also neighboring communities in Baltimore County. Collaborating and sharing best practices will allow UMBC to grow our adaptive capacity; thus, allowing us to better serve our students, employees, and visitors. UMBC has identified the following areas as major strengths/assets in our resilience portfolio:
Robust and continuously updated emergency operations planning, procedures, and structure
Well established campus safety-related services for students and employees
Extensive local/regional knowledge base found within the campus community
Climate Vulnerabilities
UMBC considered the risks identified by campus stakeholders and our annual HVA. UMBC utilized the list from the 100 Resilient Cities Climate Change related hazards, impacts, and exacerbating factors to select the following climate-related vulnerabilities to our campus:
Climate Change Hazard – Extreme Cold
Climate Change Hazard – Extreme Heat
Climate Change Hazard – Hurricane
Climate Change Hazard – Severe Storms
Climate Change Hazard – Tornado
Climate Change Impact – Infrastructure Failure
Climate Change Impact – Power Outage
From these identified vulnerabilities, UMBC considered evaluating the following three current and projected climate change impacts and their associated threats:
Increased frequency and duration of severe storms with the potential to see more tropical systems and systems capable of tornadic activities
Warmer, wetter winters
Hotter, drier summers with more high heat days
Initial Indicators of Resilience
Social Equity & Governance
Indicator
Current status and metric of measurement
Food Supply
Qualitative. Majority of dining services food is sourced from <250 miles away, there are programs available (i.e., Retriever Essentials) to help address food insecurity
Public Information Warning & Protection
Quantitative. 100 percent of the campus population has access to at least one type of public information warning system
Student Success
Quantitative. 67 percent of the 2012 cohort who were recipients of a Federal Pell Grant graduated within 6 years
Academic Success
Quantitative. In 2019 Times Higher Education ranked UMBC #3 in the nation for achieving social and economic impact – the University Impact Ranking measures how well universities deliver on UN Sustainable Development Goals.
Gender Equity
Quantitative: 2019 Times Higher Education ranked UMBC #5 nationally (#56 internationally) for the University’s work to support women in STEM at all levels — undergraduate, graduate and postgraduate, and faculty.
Health & Wellness
Indicator
Current status and metric of measurement
Access to Healthcare
Qualitative. All students have access to the University Health Services. There are several hospitals located near the university. Employees have access to health insurance coverage.
Access to Mental Health
Qualitative. All students have access to University Counseling Services. Employee health insurance options cover mental health services.
Wellness Program
Qualitative. The UMBC Wellness Initiative (WIN) is committed to the health and well-being of our campus community and understands the importance of making healthy choices that lead to a healthy lifestyle.
Ecosystems Services
Indicator
Current status and metric of measurement
Invasive Species Management
Qualitative: The university monitors and manages invasive species in accordance with the Integrated Pest Management Plan. The student run Environmental Task Force holds weekly invasive specifies clean up days where invasive species are mechanically eradicated.
Climate Appropriate Plantings
Qualitative: The university ensures that a diverse and regionally appropriate landscape exists by only selecting regionally appropriate species for planting.
Erosion Controls
Qualitative. Soil erosion is mitigated on campus with strategic plantings and mechanical mitigation when necessary.
Wildlife Management
Qualitative. The campus maintains areas that are in conservation status that can support wildlife.
Habitat Preservation/Restoration
Qualitative. Natural resources are protected through appropriate planning and management. All identified environmentally sensitive areas are managed in accordance with all Federal, State, and Local laws.
Ambient Air Quality
Quantitate. In 2018 Baltimore experienced 16 days where the eight-hour ozone concentrations exceed the 2008 health-based National Ambient Air Quality Standard
Canopy Fire Risk
Qualitative. The university actively removes dead/diseased trees and maintains mutual aid agreements and/or memorandums of understanding with other local, state, of federal agencies that can provide assistance in the event that the university’s capabilities are exceeded.
Tree Maintenance Plan
Quantitative. UMBC maintains a GIS inventory of over 3,000 campus trees.
Infrastructure
Indicator
Current status and metric of measurement
Backup Power Systems
Qualitative. Critical buildings and systems currently have backup power generation.
Contingency Plans
Qualitative. The campus maintains a Continuity of Operations Plan which supports the campus with a unified and coordinated operational structure and process that appropriately integrates all critical stakeholders and supports the execution of core capabilities.
Stormwater Infrastructure
Qualitative. UMBC ensures that stormwater infrastructure is adequately design and properly maintained to manage stormwater in full compliance and as sustainable as possible.
Potable Water Supply
Qualitative. Provide safe, clean drinking water to all students, staff, and faculty.
Water/Wastewater Systems
Qualitative. Ensure sufficient capacity and maintenance of campus systems. Provide alternative means of wastewater management if needed.
Dam Safety
Qualitative. To stabilize dam infrastructure functions and minimize health and safety threats and provide all decision-makers with decision-relevant information regarding the nature and extent of the hazard.
HVAC Systems
Qualitative. Ensure adequate redundancy of systems and monitor the efficacy of air filtration systems throughout campus at current and projected air quality readings.
Critical Transportation
Quantitative. 100% of roads/paths on campus are maintained in good working order. In the event of extreme weather, roads are serviced to keep them passable.
Economic
Indicator
Current status and metric of measurement
Energy Efficiency
Quantitative. $/square foot saved when energy efficient technologies/systems are installed.
Budgeting
Qualitative. Adequate funds are reserved for emergency preparedness and response.
Insurance
Qualitative. Maintain adequate levels and appropriate types of insurance for the campus.
A comprehensive review of the resilience indicators provides several opportunities for UMBC to address potential gaps and to improve our efforts to increase mitigation and adaptive capacity. Through this process, UMBC has identified several opportunities in the natural, built, and socio-economic environments. Consideration of opportunities is based upon economic and technical feasibility; in addition to, the level of risk presented to the campus.
Natural Environment
Assess the current impact of invasive species on the campus canopy.
Years One – Three: Survey activity and impact of the Emerald ash borer (Agrilus planipennis) on campus Ash Tree Population
Years Three – Five: Survey activity and impact of the Gypsy moth (Lymantria dispar) on campus Oak Tree Population
Years Five -Ten: Survey activity and impact of the Beech scale (Cryptococcus fagisuga Lindinger) on campus Beech Tree Population
Increase surveillance of natural flora and fauna to better asses risk of a habitat shift.
Years One – Three: Mitigate the impact of Wavyleaf basketgrass (Oplismenus undulatifolius) in the forest understory and around environmentally sensitive areas
Years Three – Five: Survey and assess the impact of Porcelain-berry (Ampelopsis glandulosa var. brevipedunculata) on campus habitats
Years Five -Ten: Survey and assess the impact of fid buttercup (Ficaria verna) on wetland areas
Draft and implement plans to ensure the health and safety of students, employees, and visitors on bad air quality days.
Year One: Draft plans for campus health and safety on bad air quality days
Year Two: Implement plans
Built Environment
Assess the capacity to refuel emergency generators and assesses the feasibility of dual fuel generators to ensure continued availability of backup power generation.
Years One – Three: Assess which generator sets are the most critical and have the greatest need for dual fuel capacity and understand refueling continuity procedures
Years Three – Five: Perform Lifecycle Cost Assessments (LCA) for potential new dual-fuel generators
Years Five -Ten: Implement an equipment replacement plan
Assess the ability of the energy management system to drill down to electrical use by building.
Years One – Three: Perform cost-benefits analysis of sub-metering technology, identify buildings with highest cooling loads
Years Three – Five: Determine which buildings use the most cooling, identify conservation measures, and perform LCA
Years Five -Ten: Install appropriate technologies and/or retrofits
Evaluate the need for the increased hardening of structures in proximity of dams on the campus
Years One – Three: Assess specific vulnerabilities of structures in proximity of campus dams
Years Three – Five: Identify opportunities for mitigation strategies
Years Five -Ten: Secure funding, via grants, to implement most feasible mitigation strategies
Evaluate UMBC transit routes that are susceptible to flooding events in Baltimore City
Years One – Three: Identify and quantify routes that currently experience disruptions; identify potential alternative routes
Years Three – Five: Develop a protocol to evaluate future routes for flooding vulnerability
Socio-Economic Environment
Evaluate supply chain continuity of dining services
Years One – Three: Review supply chain vendors to assess continuity abilities
Years Three-Five: Evaluate the feasibility of contractual mechanisms to require the submission of a COOP by suppliers
Assess the extent of the vulnerability of homeless student population.
Year One: Develop plans and procedures to support homeless student population during times of extreme events
Year Two: Implement and communicate plans and procedures for homeless population
Evaluate capacity of staff and students to telecommute
This opportunity is currently being investigated by the UMBC Transportation Work Group under the Climate Action Plan